
|
Main /
Ardupilot Soaring-AnalysisDecember 08, 2023, at 07:05 am (0 comments) 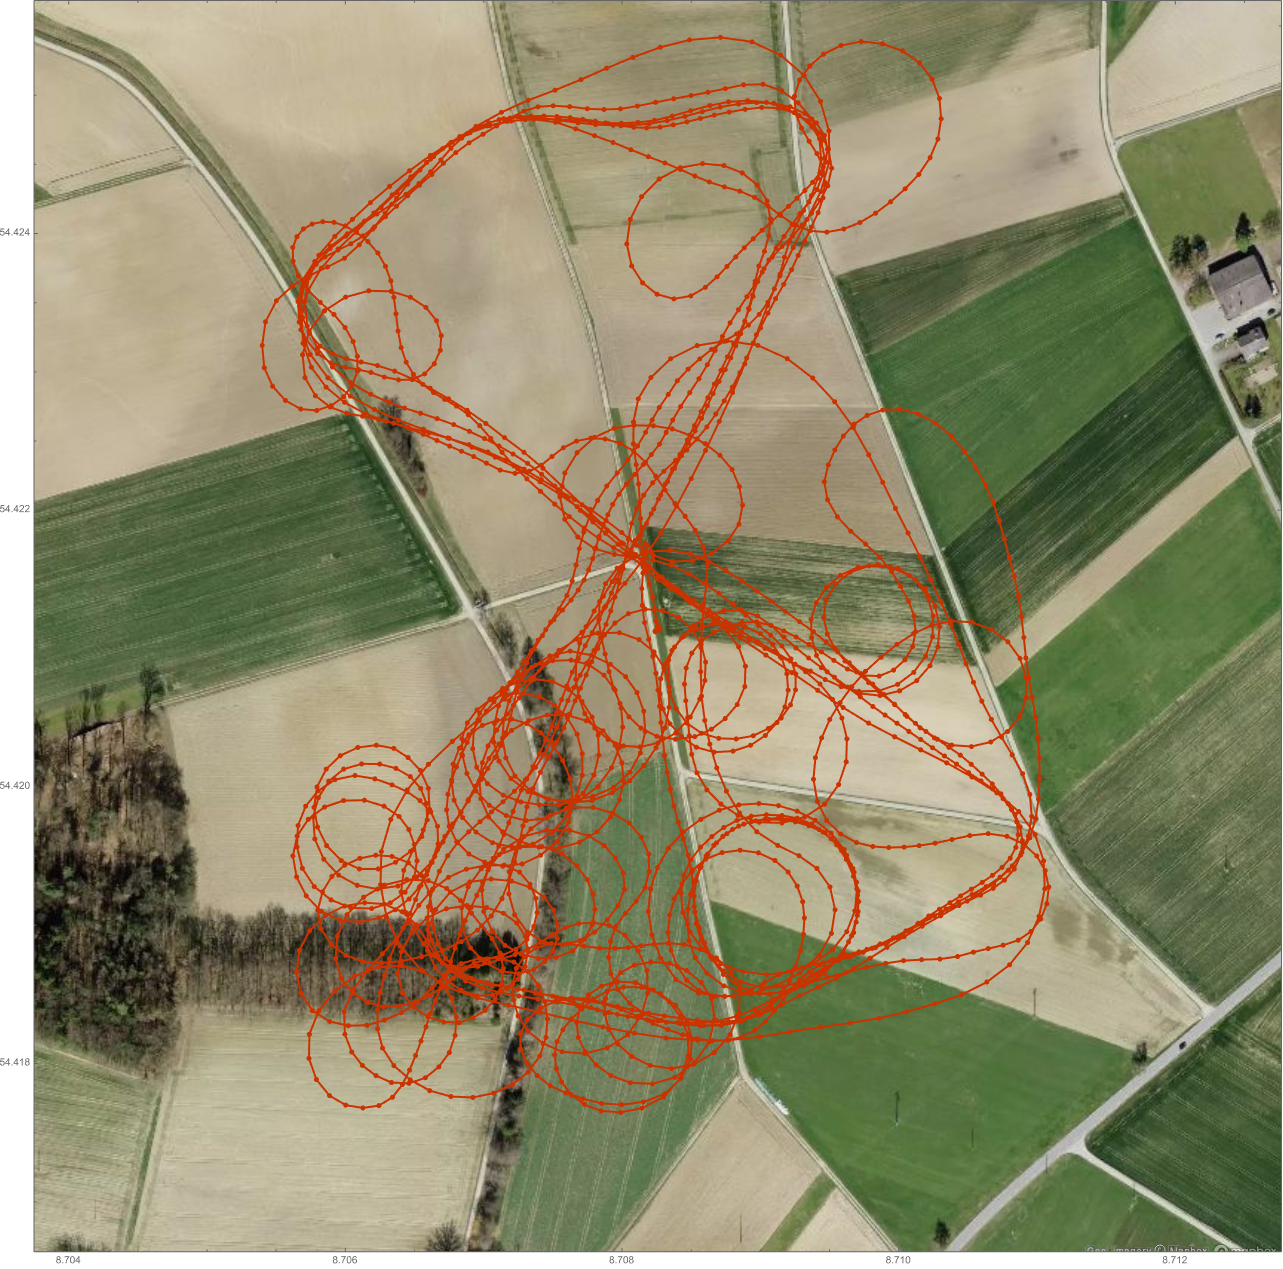 Image 1: Flight path from an automous flight  Image 2: Flight altitude profile The picture above shows the flight path of my RC glider during an "autonomous" flight. The flight computer tries to use thermal updrafts to gain altitude. The regular circles in the thermals show that this Ardupilot function obviously works. However, I was interested in how well Ardupilot can exploit thermals. The flight computer stores a large amount of data in a log file that can be easily exported. I exported the following data:
First, I divided the data into the various successful upwind phases, 13 in total. Then I tried to present the data in a meaningful way. The first graph shows where the glider is located in the upwind. The position in the upwind is plotted above the strength of the upwind.  Image 3: Position in upwind The majority of the data points are located in the upwind (< 1), but it is particularly difficult to center the aircraft in weak updrafts. The second image shows the rate of climb as a function of the position in the upwind, also scaled in a way that allows the different upwind phases to be compared directly.  Image 4: Climb rate in the thermal The majority of the measured values here are in the upwind as well. This graph also gives an indication of the distribution of the upwind depending on the distance from its center.  Image 5: Climb rate versus thermal nettorate Not entirely surprisingly, this relationship is practically perfectly linear with a slope of almost 1. The straight line shown in the graph has the equation y = -0.748773 + 0.999582 x. The axis intercept describes the quality of the glider. An upwind of 0.75 m/s is just enough to maintain altitude. See the technical data of the glider in this Blogbeitrag My very personal conclusion: The Ardupilot Soaring Mode works amazingly well - at least with updrafts that are well above the minimum (0.75m/s for my glider). |